Anscombe’s Quartet is a group of 4 datasets with almost identical mean and sample variance in X and Y, correlation between X/Y, linear regression lines, and R^2 value of those lines.
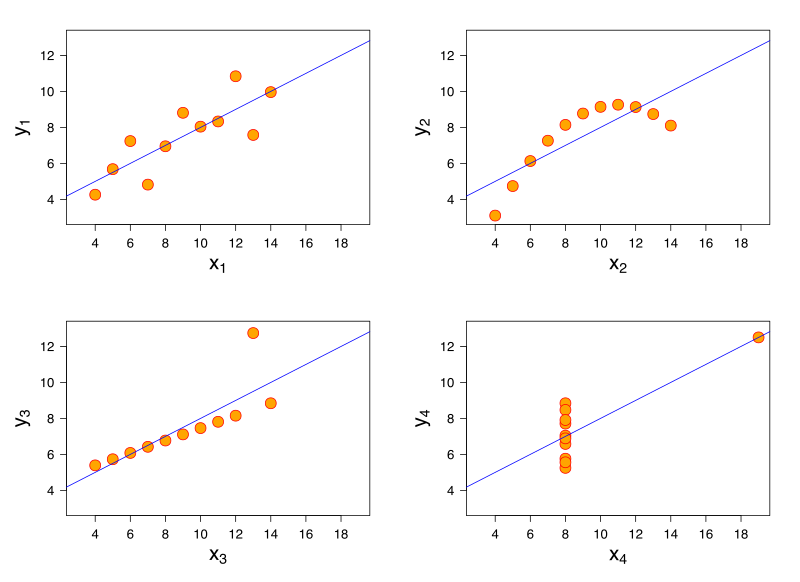
When you plot them, though, it becomes abundantly clear that those summary statistics are not sufficient to draw effective conclusions about the data. To be clear, summary statistics are often still useful, especially for automated approaches. But when a human is in the analysis loop, visualisation is essentially always preferable.
The human visual system is extremely useful and robust and probably the most general tool that we have for analysing data. Before visualising a mystery dataset, we probably have no idea if a pattern exists; if it makes sense to try and fit a line or curve or classify into clusters, to use a hard or fuzzy classifier, or to do some other kind of data magic. The scatter and line plots as ways you can represent data did not always exist! They had to be invented, as did any other method we use; how much more difficult data analysis would be if we only ever viewed it in tabulated form.
Always visualise first. It can prevent hours or weeks or worse on wild goose chases. Our brains evolved to notice patterns and anomalies and make predictions based on those observations - though you should try to avoid hallucinating patterns where there are none. Before coming up with any clever tricks, just… look? Just look at the data, and important qualitative information will become clear to you. And if you can Do The Thing when you look at the data, like identify some pattern, then rather than throwing speculative machine learning techniques at opaque and inscrutable datasets to Do The Thing, the ML has to learn a pattern your brain already knows is there - and rather than praying that Big Data Majjicks make an answer fall out, you can be confident that it’s a problem which can be solved at all.